Gold Price Forecast
Gold Price Forecast by Month
London Fix. US Dollars per troy ounce.
| Month | Date | Forecast Value | Avg Error |
|---|---|---|---|
| 0 | May 2026 | 4585.29 | ±0.00 |
| 1 | Jun 2026 | 4551.0 | ±17.9 |
| 2 | Jul 2026 | 4463.0 | ±20.7 |
| 3 | Aug 2026 | 4357.0 | ±22.4 |
| 4 | Sep 2026 | 4311.0 | ±23.6 |
| 5 | Oct 2026 | 4426.0 | ±24.5 |
| 6 | Nov 2026 | 4382.0 | ±25.2 |
| 7 | Dec 2026 | 4458.0 | ±25.9 |
| 8 | Jan 2027 | 4434.0 | ±26.4 |
Get the Rest of the Story with the 5 Year Forecast!
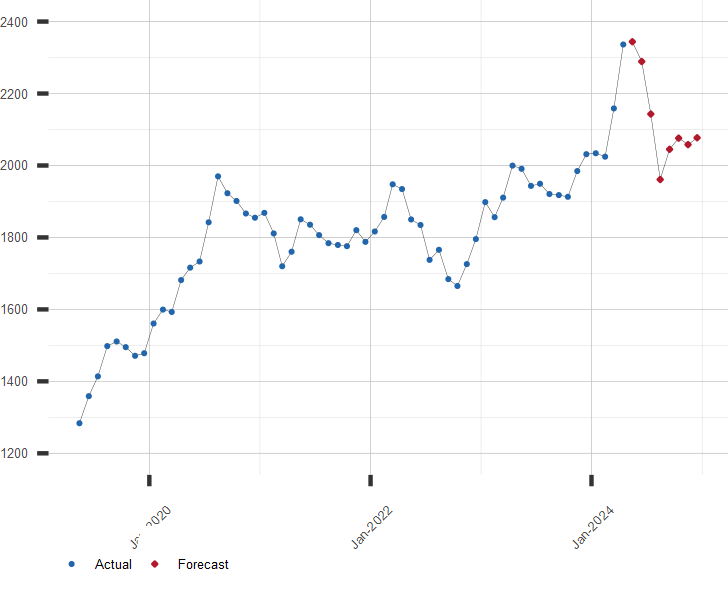
Chart of Gold Prices With Forecast
London Fix. US Dollars per troy ounce. Includes Forecast.
Other Commodity Price Links of Interest:
A long range forecast for Gold Price and similar economic series is available by subscription. Click here for more information or to subscribe now!
| June 08, 2026 | |
| Indicator | Value |
|---|---|
| S&P 500 | 7405.73 |
| U.S. GDP Growth, YoY % | 2.57 |
| U.S. Inflation Rate, % | 3.81 |
| Gold Price, $/oz-t | 4327.50 |
| Crude Oil Futures, $/bbl | 91.25 |
| U.S. 10 Year Treasury, % | 4.56 |