U.S. Retail Sales Growth Rate Forecast
Retail Sales Growth Forecast Values
Percent Change in Retail and Food Service Sales, Annual
| Month | Date | Forecast Value | Avg Error |
|---|---|---|---|
| 0 | Apr 2026 | 4.62 | ±0.00 |
| 1 | May 2026 | 5.80 | ±0.49 |
| 2 | Jun 2026 | 5.10 | ±0.57 |
| 3 | Jul 2026 | 1.90 | ±0.62 |
| 4 | Aug 2026 | 3.20 | ±0.66 |
| 5 | Sep 2026 | 2.70 | ±0.68 |
| 6 | Oct 2026 | 3.90 | ±0.71 |
| 7 | Nov 2026 | 4.30 | ±0.72 |
| 8 | Dec 2026 | 3.80 | ±0.74 |
Get the Rest of the Story with the 5 Year Forecast!
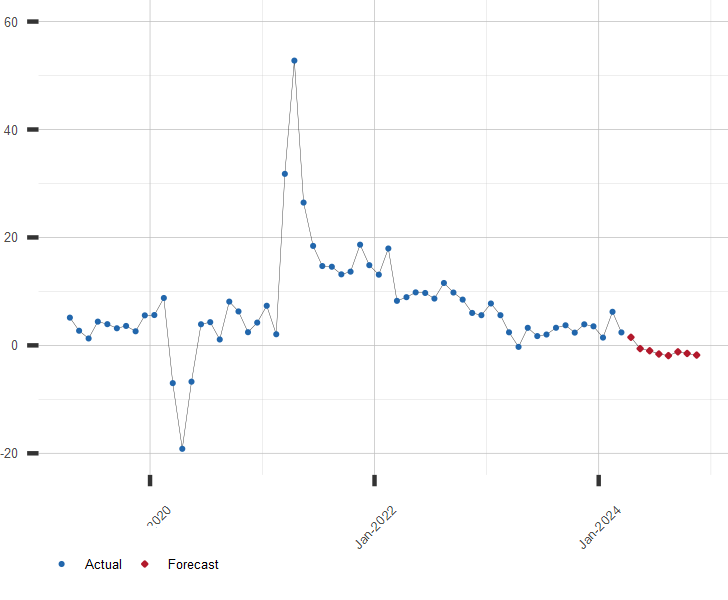
Chart of Retail Sales Growth Rate
Year over Year Percent Change in Retail Sales
Other Retail Sales and Consumer Related Resources:
A long range forecast for this and similar economic series is available by subscription. Click here for more information or to subscribe.
| June 08, 2026 | |
| Indicator | Value |
|---|---|
| S&P 500 | 7405.73 |
| U.S. GDP Growth, YoY % | 2.57 |
| U.S. Inflation Rate, % | 3.81 |
| Gold Price, $/oz-t | 4327.50 |
| Crude Oil Futures, $/bbl | 91.25 |
| U.S. 10 Year Treasury, % | 4.56 |