Financial Market and Economic Forecasts
The Financial Forecast Center is a leading independent producer of accurate, data-driven forecasts across a wide spectrum of financial and economic indicators.
FFC provides monthly updated forecasts for interest rates, exchange rates, stock indexes, inflation, economic growth, gold, silver and crude oil.
| As of October 23, 2026 | |||
|---|---|---|---|
| Indicator | Current | Forecast for October |
Forecast for November |
| S&P 500 | 7623.68 | 7689 | 7813 |
| 30 Yr Treasury | 5.33 | 5.51 | 5.45 |
| EUR to USD | 1.120 | 1.124 | 1.112 |
| GBP to USD | 1.337 | 1.322 | 1.299 |
| CAD to USD | 1.401 | 1.419 | 1.430 |
| Gold Price | 4013.30 | 4182 | 4069 |
| Crude Oil Price | 104.27 | 102.1 | 104.4 |
October 2026 Financial and Economic Outlook
December rate increase: The federal funds rate and prime rate are each forecast to increase by 25 basis points (0.25 percentage point) in December 2026.
Interest Rates: December Increase
The fed funds and prime rate tables show monthly averages of 3.88% and 7.00% in October–November, 4.06% and 7.18% in December, and 4.13% and 7.25% in January–February. December's averages reflect an increase during the month; January's averages reflect the full 25-basis-point rise. Rates climb again to 4.24% and 7.36% in March, then 4.38% and 7.50% in April–May.
The 10-year Treasury yield moves from 5.14% in October to 5.08% in November, peaks at 5.34% in January, and eases to 5.08% in May, with a March uptick. The 30-year mortgage rate dips from 7.34% in October to 7.26% in November, peaks at 7.45% in December, and trends down to 7.14% in May, with an April uptick.
U.S. Stock Indexes
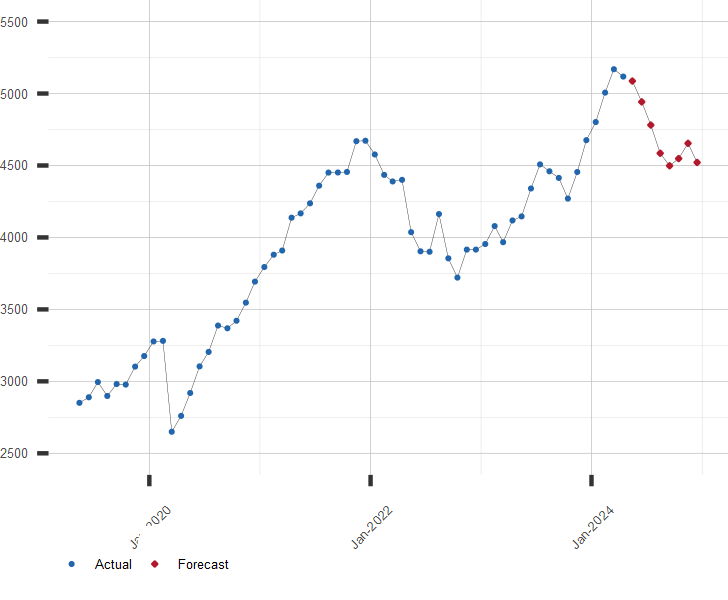
All four indexes rise from October through February, retreat in March, and reach their forecast-period highs in May. The S&P 500 advances from 7,689 in October to 7,963 in December and 8,083 in February, dips to 7,963 in March, and reaches 8,313 in May. October-to-May levels increase from 52,024 to 55,981 for the Dow, 26,652 to 29,039 for the Nasdaq, and 2,809 to 3,063 for the Russell 2000.
Major Exchange Rates
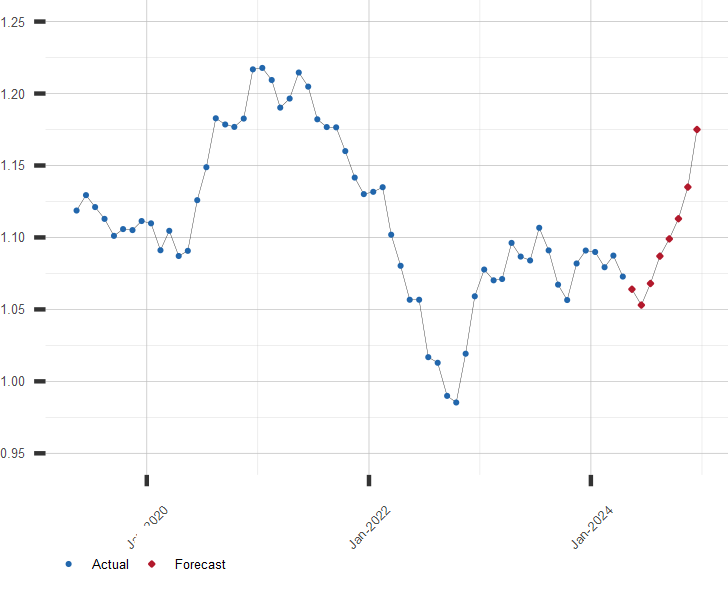
EUR/USD, GBP/USD, and AUD/USD reach December lows of 1.106, 1.293, and 0.695, recover to April highs of 1.164, 1.353, and 0.715, and ease to 1.154, 1.343, and 0.710 in May.
USD/JPY peaks at 161.5 in December, falls to 153.4 in April, and rebounds to 155.1 in May. USD/MXN follows a similar path: 18.67 in December, 17.77 in April, and 17.93 in May. USD/CNY stays within 6.69–6.73 and ends May at 6.69.
U.S. Growth, Inflation, and Unemployment
Real GDP growth eases from 2.37% in October–December to 2.33% in January–February. CPI inflation rises from 4.01% in October to a November peak of 4.15%, then declines to 4.09% in December, 2.35% in March, and 1.37% in May. Unemployment holds at 4.2% through December, briefly reaches 4.3% in January and March, and ends May at 4.2%.
Gold, Silver, and Crude Oil
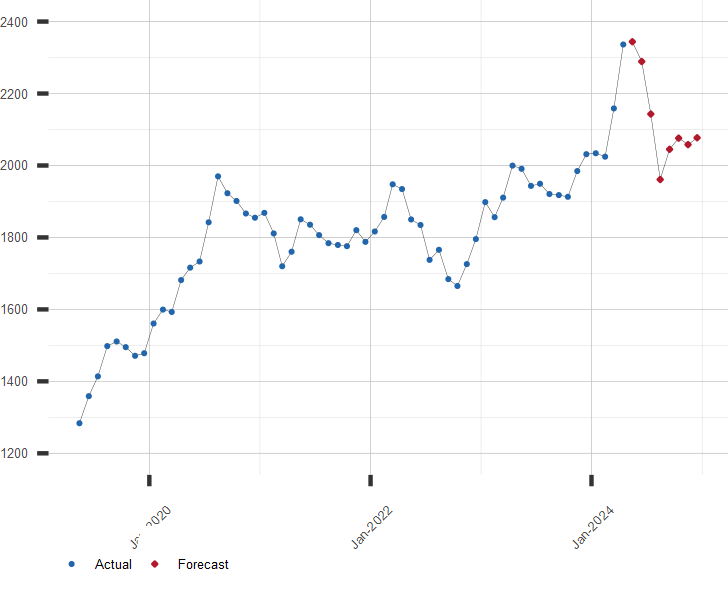
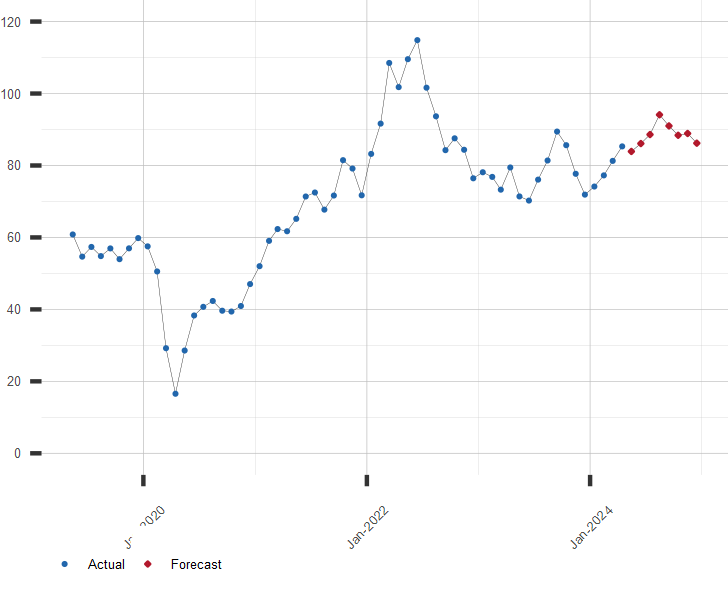
Gold falls from $4,183 per troy ounce in October to $4,079 in December, recovers to $4,437 in April, and eases to $4,373 in May. Silver falls from $58.08 per troy ounce in October to a November low of $56.11, rebounds to $60.49 in December, and climbs to $73.94 in April before easing to $73.49 in May. Crude oil rises from $102.10 per barrel in October to $104.40 in November, then declines each month to $96.80 in December and $75.80 in May.
Coverage: October 2026–May 2027 where published. Stock indexes, interest rates, exchange rates, and commodity prices are monthly averages. GDP growth and CPI inflation are year-over-year changes. The public GDP table ends in February.
About Our Forecasts
The Financial Forecast Center has published independent financial and economic forecasts since 1997. Forecasts are generated in-house using artificial-intelligence models applied to historical financial and economic data. Forecast values are monthly averages unless otherwise noted.
Learn more about our forecasting methodology and see our S&P 500 forecast accuracy history, which reports monthly Percent Error.
Popular Forecasts
S&P 500 Forecast
EUR/USD Forecast
Gold Price Forecast, USD/t-oz
WTI Oil Price Forecast, USD/BBL
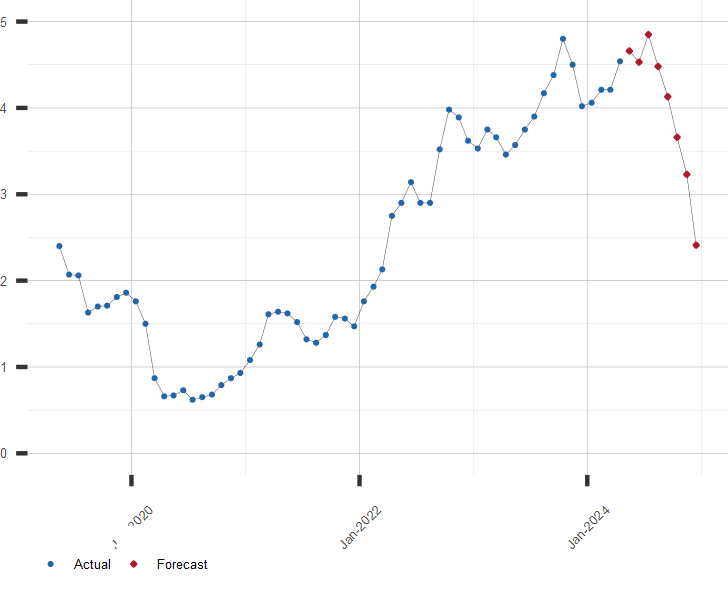
U.S. 10 Year Treasury Rate Forecast, %
View All Stock Market Forecasts
View All Exchange Rate Forecasts
View All Interest Rate Forecasts
View All Commodity Price Forecasts
View All Economic Indicator Forecasts
Browse The Complete Forecast Directory
| October 23, 2026 | |
| Indicator | Value |
|---|---|
| S&P 500 | 7623.68 |
| U.S. GDP Growth, YoY % | 2.19 |
| U.S. Inflation Rate, % | 3.74 |
| Gold Price, $/oz-t | 4013.30 |
| Crude Oil Futures, $/bbl | 104.27 |
| U.S. 10 Year Treasury, % | 5.00 |