S&P 500 Forecast
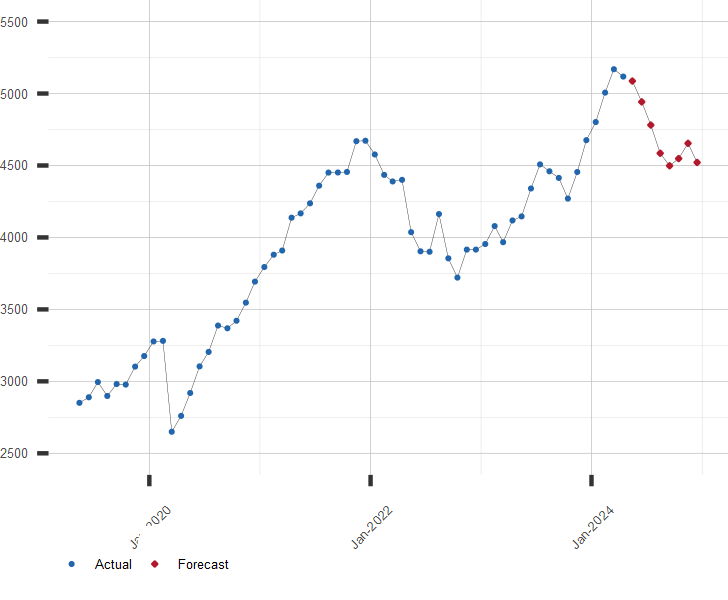
The S&P 500 is forecast to move as follows over the next 8 months. This forecast is produced based on prior values of the S&P 500 along with other factors such as corporate earnings, other stock markets, interest rates, currency exchange rates, and economic indicators.
S&P 500 Forecast Values
Stock Price Index Values, Average of Month.
| Month | Date | Forecast Value | Avg Error |
|---|---|---|---|
| 0 | Mar 2025 | 5686.20 | ±0.00 |
| 1 | Apr 2025 | 5360 | ±52 |
| 2 | May 2025 | 5590 | ±60 |
| 3 | Jun 2025 | 5202 | ±64 |
| 4 | Jul 2025 | 5420 | ±67 |
| 5 | Aug 2025 | 5228 | ±70 |
| 6 | Sep 2025 | 5339 | ±72 |
| 7 | Oct 2025 | 5436 | ±73 |
| 8 | Nov 2025 | 5496 | ±75 |
Get the Rest of the Story with the 5 Year Forecast!
S&P 500 Forecast Chart
Stock Price Index Values in USD, Average of Month.

S&P 500
The S&P 500, or the Standard and Poor's 500, is a U.S. stock market index based on the market capitalizations of 500 of the largest companies having common stock listed on the NYSE and NASDAQ stock exchanges. It is one of the most commonly followed equity indexes, and it is a fair representation of the value of the U.S. stock market as a whole.
The S&P 500 is a capitalization-weighted index in that the weight of each company's stock price is determined by the total market value of that company's outstanding shares. This means that as the price of one particular stock increases, that stock price is weighted more heavily in the calculation of the index.
Other Stock Market Resources of Interest:
A long range forecast of the S&P 500 and many other stock market indexes is available by subscription. Click here for more information or to subscribe now.
| April 14, 2025 | ||
| Stock Market | Value | Change |
|---|---|---|
| U.S. S&P 500 | 5,405.97 | 0.79% |
| Japan Nikkei 225 | 33,982.36 | 1.18% |
| Hong Kong Hang Seng | 21,417.40 | 2.40% |
| UK FTSE 100 | 8,134.34 | 2.14% |
| German DAX | 20,954.83 | 2.85% |
| Brazil Bovespa | 129,453.91 | 1.39% |