Wilshire 5000 Stock Index Forecast
Wilshire 5000 Forecast Values
Stock Price Index Values, Average of Month.
| Month | Date | Forecast Value | Avg Error |
|---|---|---|---|
| 0 | Feb 2025 | 60582.94 | ±0.00 |
| 1 | Mar 2025 | 56575 | ±494 |
| 2 | Apr 2025 | 58329 | ±644 |
| 3 | May 2025 | 59523 | ±731 |
| 4 | Jun 2025 | 59990 | ±793 |
| 5 | Jul 2025 | 60710 | ±842 |
| 6 | Aug 2025 | 59330 | ±881 |
| 7 | Sep 2025 | 58480 | ±914 |
| 8 | Oct 2025 | 59490 | ±943 |
Get the Rest of the Story with the 5 Year Forecast!
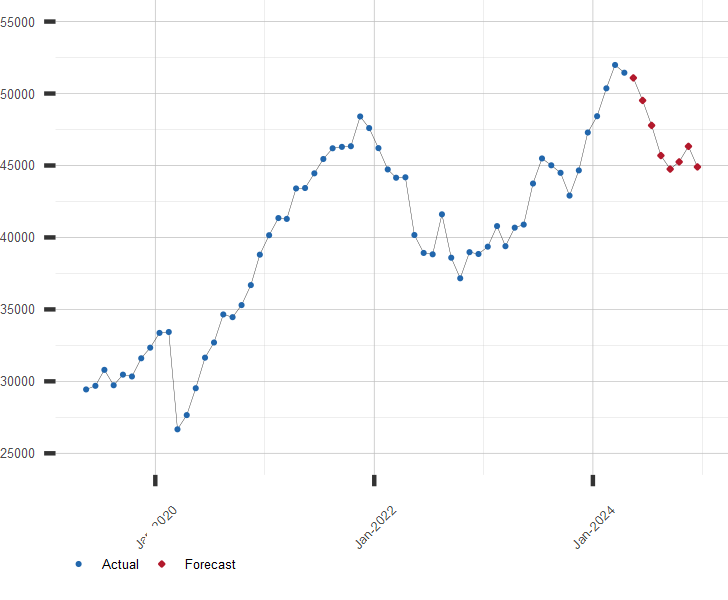
Chart of Wilshire 5000 with Forecast
Stock Price Index Values, Average of Month.
Other Wilshire 5000 and Stock Market Resources:
A long range forecast for the Wilshire 5000 and similar financial series is available by subscription. Click here to subscribe now!
| March 27, 2025 | ||
| Stock Market | Value | Change |
|---|---|---|
| U.S. S&P 500 | 5,693.31 | -0.33% |
| Japan Nikkei 225 | 37,799.37 | -0.60% |
| Hong Kong Hang Seng | 23,578.80 | 0.41% |
| UK FTSE 100 | 8,666.12 | -0.27% |
| German DAX | 22,678.74 | -0.70% |
| Brazil Bovespa | 133,148.75 | 0.47% |