U.S. Imports Forecast
Imports Forecast Values
Imports of Goods and Services Into U.S. Billion US Dollars. Annual Rate, SA.
| Month | Date | Forecast Value | Avg Error |
|---|---|---|---|
| 0 | Jun 2026 | 4620.9 | ±0.0 |
| 1 | Jul 2026 | 4695.0 | ±28.6 |
| 2 | Aug 2026 | 4695.0 | ±28.6 |
| 3 | Sep 2026 | 4695.0 | ±28.6 |
| 4 | Oct 2026 | 4745.0 | ±35.7 |
| 5 | Nov 2026 | 4745.0 | ±35.7 |
| 6 | Dec 2026 | 4745.0 | ±35.7 |
| 7 | Jan 2027 | 4802.0 | ±38.5 |
| 8 | Feb 2027 | 4802.0 | ±38.5 |
Get the Rest of the Story with the 5 Year Forecast!
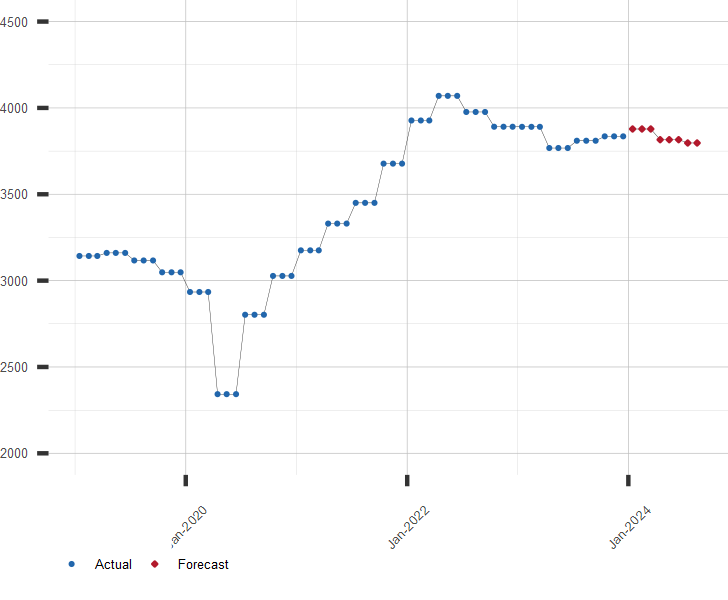
Chart of U.S. Imports with Current Forecast.
Billion US Dollars. Annual Rate, Seasonally Adjusted.
Other Import and Export Links of Interest:
Long range forecasts of U.S. Imports and Exports are available by subscription. Click here for more information or to subscribe to U.S. Imports Extended Forecast.
| August 14, 2026 | |
| Indicator | Value |
|---|---|
| S&P 500 | 7785.76 |
| U.S. GDP Growth, YoY % | 2.10 |
| U.S. Inflation Rate, % | 3.30 |
| Gold Price, $/oz-t | 4390.70 |
| Crude Oil Futures, $/bbl | 82.40 |
| U.S. 10 Year Treasury, % | 4.68 |