Forecast of Mexico IPC Stock Index
IPC Forecast Values
Stock Price Index Values. Average of Month.
| Month | Date | Forecast Value | Avg Error |
|---|---|---|---|
| 0 | Aug 2026 | 65676.23 | ±0.00 |
| 1 | Sep 2026 | 64711.0 | ±1280.0 |
| 2 | Oct 2026 | 63242.0 | ±1619.6 |
| 3 | Nov 2026 | 64690.0 | ±1818.3 |
| 4 | Dec 2026 | 66110.0 | ±1959.3 |
| 5 | Jan 2027 | 66807.0 | ±2068.6 |
| 6 | Feb 2027 | 67385.0 | ±2158.0 |
| 7 | Mar 2027 | 66496.0 | ±2233.5 |
| 8 | Apr 2027 | 67892.0 | ±2298.9 |
Get the Rest of the Story with the 5 Year Forecast!
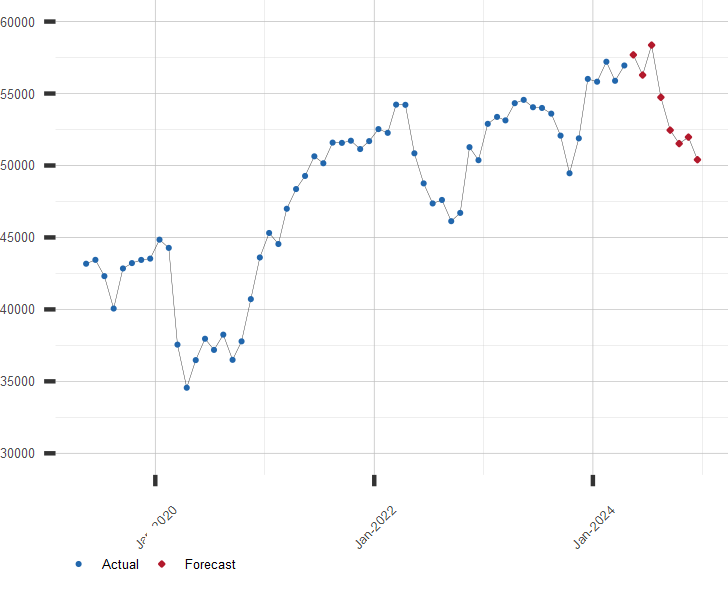
Chart of IPC Stock Index with Forecast
Mexican Stock Price Index Values. Average of Month.
Other Stock Market Related Resources:
A long range forecast for the Mexican IPC and similar financial series is available by subscription. Click here for more information or to subscribe.
| September 03, 2026 | ||
| Stock Market | Value | Change |
|---|---|---|
| U.S. S&P 500 | 7,747.71 | 1.06% |
| Japan Nikkei 225 | 64,214.48 | -0.17% |
| Hong Kong Hang Seng | 25,213.31 | -0.39% |
| UK FTSE 100 | 10,831.52 | 0.70% |
| German DAX | 26,003.32 | 0.63% |
| Brazil Bovespa | 185,188.12 | -0.01% |