U.S. Retail Sales Forecast
U.S. Retail Sales Forecast Values
Retail & Food Services Sales. Million USD. Not Seasonally Adjusted.
| Month | Date | Forecast Value | Avg Error |
|---|---|---|---|
| 0 | Jun 2026 | 776915.0 | ±0.0 |
| 1 | Jul 2026 | 774000.0 | ±3900.0 |
| 2 | Aug 2026 | 769100.0 | ±4523.8 |
| 3 | Sep 2026 | 725400.0 | ±4888.8 |
| 4 | Oct 2026 | 769900.0 | ±5147.7 |
| 5 | Nov 2026 | 769700.0 | ±5348.5 |
| 6 | Dec 2026 | 848300.0 | ±5512.6 |
| 7 | Jan 2027 | 689900.0 | ±5651.3 |
| 8 | Feb 2027 | 676400.0 | ±5771.5 |
Get the Rest of the Story with the 5 Year Forecast!
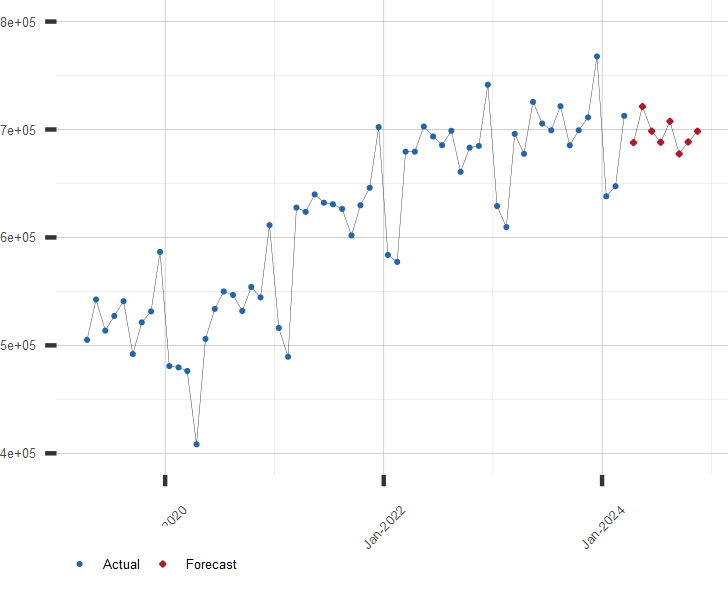
Chart of U.S. Retail Sales
Million USD. Not Seasonally Adjusted. Includes Forecast
Other Retail Sales Resources:
A long range forecast for U.S. Retail Sales and similar economic series is available by subscription. Click here for more information or to subscribe.
| July 30, 2026 | |
| Indicator | Value |
|---|---|
| S&P 500 | 7437.63 |
| U.S. GDP Growth, YoY % | 2.10 |
| U.S. Inflation Rate, % | 3.53 |
| Gold Price, $/oz-t | 4113.10 |
| Crude Oil Futures, $/bbl | 83.67 |
| U.S. 10 Year Treasury, % | 4.68 |