Hong Kong Hang Seng Index Forecast
Hong Kong's Hang Seng Index Forecast Values
Stock Price Index Values, Average of Month.
| Month | Date | Forecast Value | Avg Error |
|---|---|---|---|
| 0 | Jun 2026 | 24296.78 | ±0.00 |
| 1 | Jul 2026 | 24494.0 | ±838.0 |
| 2 | Aug 2026 | 24729.0 | ±925.3 |
| 3 | Sep 2026 | 24990.0 | ±976.4 |
| 4 | Oct 2026 | 24561.0 | ±1012.7 |
| 5 | Nov 2026 | 25039.0 | ±1040.8 |
| 6 | Dec 2026 | 25428.0 | ±1063.8 |
| 7 | Jan 2027 | 25700.0 | ±1083.2 |
| 8 | Feb 2027 | 26020.0 | ±1100.0 |
Get the Rest of the Story with the 5 Year Forecast!
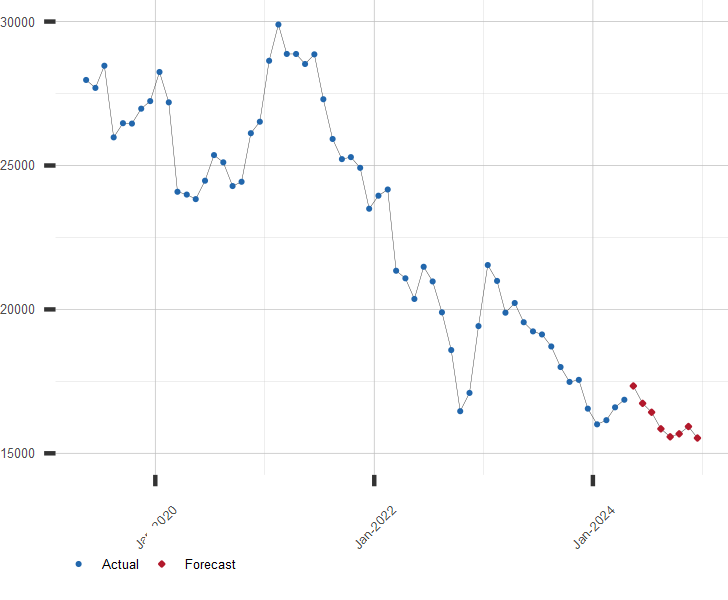
Chart of Hang Seng Stock Index with Forecast
Stock Price Index Values, Average of Month.
Other Hang Seng Stock Index Related Links of Interest:
A long range forecast for the Hang Seng Index and similar financial series is available by subscription. Click here to subscribe to the Hang Seng Extended Forecast
| July 16, 2026 | ||
| Stock Market | Value | Change |
|---|---|---|
| U.S. S&P 500 | 7,533.77 | -0.51% |
| Japan Nikkei 225 | 66,835.54 | -2.79% |
| Hong Kong Hang Seng | 25,008.60 | 1.33% |
| UK FTSE 100 | 10,572.24 | 0.54% |
| German DAX | 24,915.49 | -0.34% |
| Brazil Bovespa | 173,825.27 | -1.24% |