NASDAQ Composite Index Forecast
NASDAQ Composite Forecast Values
Stock Price Index Values, Average of Month.
| Month | Date | Forecast Value | Avg Error |
|---|---|---|---|
| 0 | Jun 2026 | 26097.29 | ±0.00 |
| 1 | Jul 2026 | 26111.0 | ±123.0 |
| 2 | Aug 2026 | 26481.0 | ±148.6 |
| 3 | Sep 2026 | 26886.0 | ±163.6 |
| 4 | Oct 2026 | 26470.0 | ±174.3 |
| 5 | Nov 2026 | 27140.0 | ±182.5 |
| 6 | Dec 2026 | 27700.0 | ±189.3 |
| 7 | Jan 2027 | 28120.0 | ±195.0 |
| 8 | Feb 2027 | 28610.0 | ±199.9 |
Get the Rest of the Story with the 5 Year Forecast!
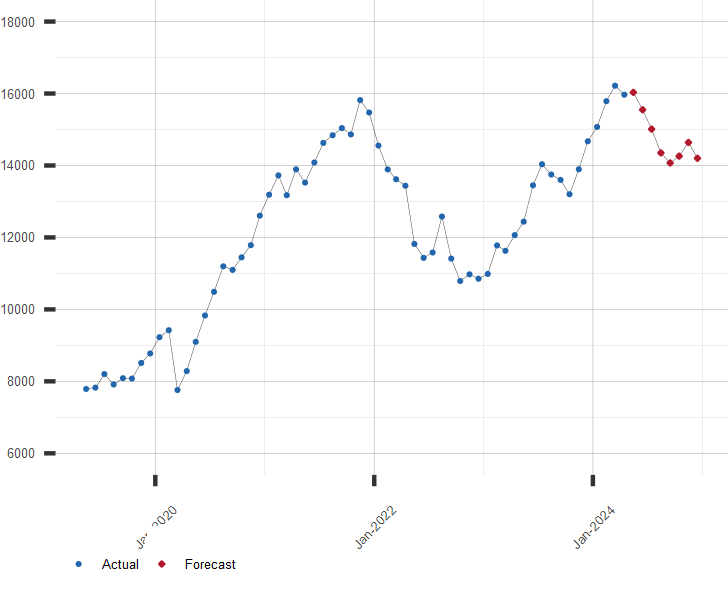
Chart of NASDAQ Composite Index
NASDAQ Composite, Average of Month. Includes Current Prediction.
Other NASDAQ Stock Index Resources:
A long range forecast for the NASDAQ Composite and similar financial series is available by subscription
Click here to subscribe to the NASDAQ Composite Extended Forecast.| July 16, 2026 | ||
| Stock Market | Value | Change |
|---|---|---|
| U.S. S&P 500 | 7,533.77 | -0.51% |
| Japan Nikkei 225 | 66,835.54 | -2.79% |
| Hong Kong Hang Seng | 25,008.60 | 1.33% |
| UK FTSE 100 | 10,572.24 | 0.54% |
| German DAX | 24,915.49 | -0.34% |
| Brazil Bovespa | 173,825.27 | -1.24% |