S&P 500 Forecast
S&P 500 Stock Index Forecast Values
Stock Price Index Values, Average of Month.
| Month | Date | Forecast Value | Avg Error |
|---|---|---|---|
| 0 | Jul 2026 | 7480.83 | ±0.00 |
| 1 | Aug 2026 | 7548.0 | ±52.0 |
| 2 | Sep 2026 | 7654.0 | ±59.6 |
| 3 | Oct 2026 | 7391.0 | ±64.1 |
| 4 | Nov 2026 | 7586.0 | ±67.2 |
| 5 | Dec 2026 | 7778.0 | ±69.7 |
| 6 | Jan 2027 | 7896.0 | ±71.7 |
| 7 | Feb 2027 | 7999.0 | ±73.4 |
| 8 | Mar 2027 | 7856.0 | ±74.9 |
Get the Rest of the Story with the 5 Year Forecast!
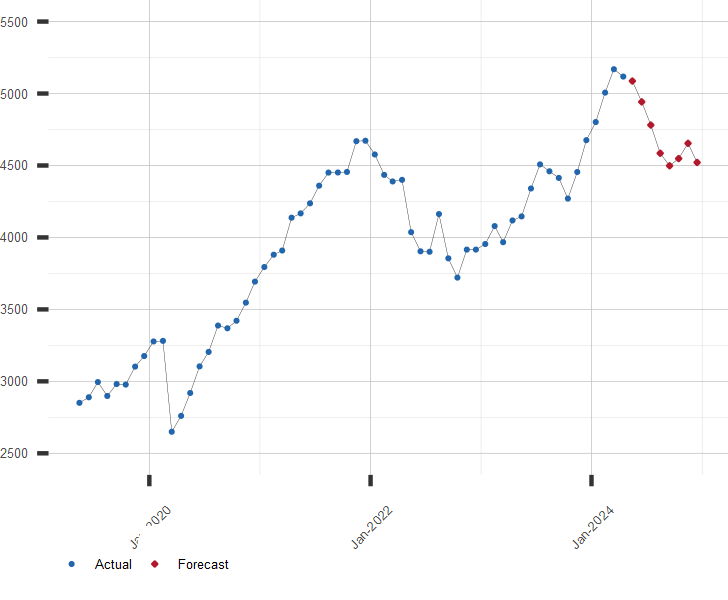
S&P 500 Stock Index Chart
Chart of S&P 500 with Current Projection
Other Stock Market Resources:
A long range forecast for this or similar financial series is available by subscription
Click here for more information or to subscribe now| July 31, 2026 | ||
| Stock Market | Value | Change |
|---|---|---|
| U.S. S&P 500 | 7,489.72 | 0.70% |
| Japan Nikkei 225 | 64,362.02 | 4.03% |
| Hong Kong Hang Seng | 25,884.43 | 0.10% |
| UK FTSE 100 | 10,868.05 | -0.27% |
| German DAX | 25,629.24 | 0.07% |
| Brazil Bovespa | 177,999.00 | 0.47% |