U.S. Industrial Production Index Forecast IIP
Industrial Production Index Forecast Values
Index Values. 2012=100. Seasonally Adjusted.
| Month | Date | Forecast Value | Avg Error |
|---|---|---|---|
| 0 | Jun 2026 | 102.639 | ±0.000 |
| 1 | Jul 2026 | 102.83 | ±0.25 |
| 2 | Aug 2026 | 102.65 | ±0.29 |
| 3 | Sep 2026 | 102.84 | ±0.31 |
| 4 | Oct 2026 | 103.21 | ±0.33 |
| 5 | Nov 2026 | 103.41 | ±0.34 |
| 6 | Dec 2026 | 103.17 | ±0.35 |
| 7 | Jan 2027 | 103.44 | ±0.36 |
| 8 | Feb 2027 | 103.76 | ±0.36 |
Get the Rest of the Story with the 5 Year Forecast!
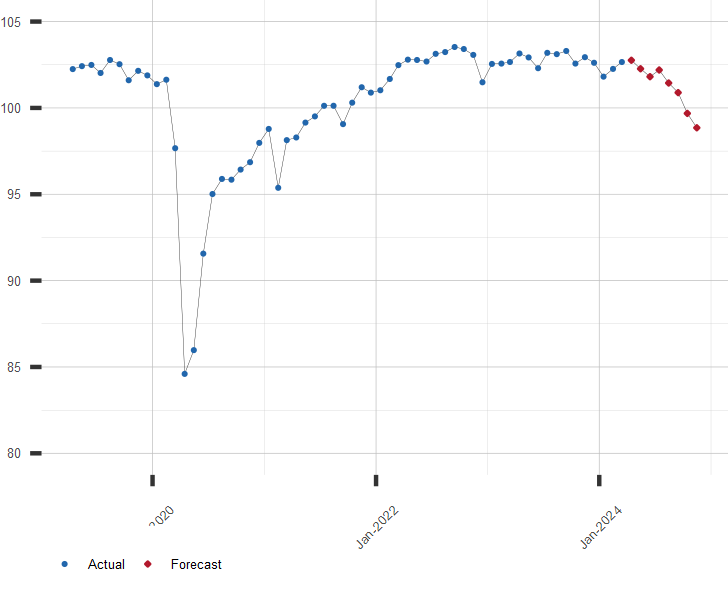
Chart of Industrial Production Index
Index Values. 2012=100.
Other Industrial Production Resources:
A long range forecast for the IIP and similar economic series is available by subscription. Click here for more information or to subscribe.
| July 23, 2026 | |
| Indicator | Value |
|---|---|
| S&P 500 | 7408.30 |
| U.S. GDP Growth, YoY % | 2.68 |
| U.S. Inflation Rate, % | 3.53 |
| Gold Price, $/oz-t | 4048.50 |
| Crude Oil Futures, $/bbl | 91.56 |
| U.S. 10 Year Treasury, % | 4.71 |