The Financial Forecast Center™
Independent. Objective. Accurate.
Home
About Us
Contact Us
Subscribe
Subscriber Log In
Stock Market Forecasts
Interest Rate Forecasts
Exchange Rate Forecasts
Economics & Price Forecasts
Historical Data
Popular Forecasts
Exchange Rate Forecasts
Interest Rate Forecasts
Stock Market Forecasts
Price and Economy Forecasts
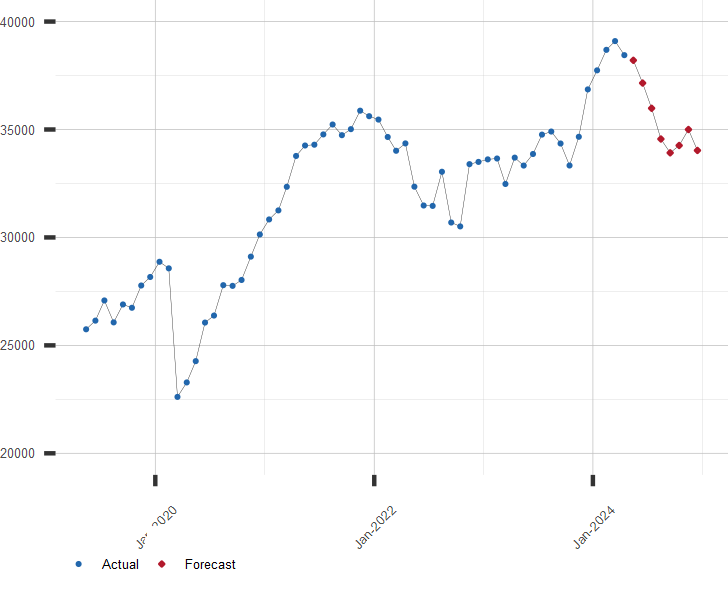
Dow Jones Industrial Average Outlook
Dow Jones Industrial Average Forecast Values.
DJIA Index Values, Average of Month.
| Month |
Date |
Forecast Value |
Avg Error |
| 0 |
May 2026 |
49895.37 |
±0.00 |
| 1 |
Jun 2026 |
51277.0 |
±365.0 |
| 2 |
Jul 2026 |
51878.0 |
±417.7 |
| 3 |
Aug 2026 |
52388.0 |
±448.5 |
| 4 |
Sep 2026 |
52830.0 |
±470.4 |
| 5 |
Oct 2026 |
53500.0 |
±487.3 |
| 6 |
Nov 2026 |
54230.0 |
±501.2 |
| 7 |
Dec 2026 |
55320.0 |
±512.9 |
| 8 |
Jan 2027 |
56020.0 |
±523.0 |
Download Historical Data
Get the Rest of the Story with the 5 Year Forecast!
DJIA Chart
Chart of the DJIA with Current Projection.
Other Stock Market Links of Interest:
A long range forecast for the DJIA and similar financial series are available by subscription
Click here for more information or to subscribe now
Current Stock Markets
| June 9, 2026 |
| Stock Market |
Value |
Change |
| U.S. S&P 500 |
7,386.65 |
-0.26% |
| Japan Nikkei 225 |
65,416.63 |
2.17% |
| Hong Kong Hang Seng |
24,565.90 |
-0.37% |
| UK FTSE 100 |
10,227.33 |
-1.41% |
| German DAX |
24,433.06 |
-0.74% |
| Brazil Bovespa |
169,813.16 |
0.68% |