U.S. Inventory to Sales Ratio Forecast
Inventory to Sales Ratio Forecast Values
Ratio Total Business Inventory to Sales. Seasonally Adjusted.
| Month | Date | Forecast Value | Avg Error |
|---|---|---|---|
| 0 | Mar 2026 | 1.32 | ±0.00 |
| 1 | Apr 2026 | 1.31 | ±0.0083 |
| 2 | May 2026 | 1.32 | ±0.01 |
| 3 | Jun 2026 | 1.33 | ±0.012 |
| 4 | Jul 2026 | 1.35 | ±0.012 |
| 5 | Aug 2026 | 1.35 | ±0.013 |
| 6 | Sep 2026 | 1.35 | ±0.014 |
| 7 | Oct 2026 | 1.35 | ±0.014 |
| 8 | Nov 2026 | 1.36 | ±0.015 |
Get the Rest of the Story with the 5 Year Forecast!
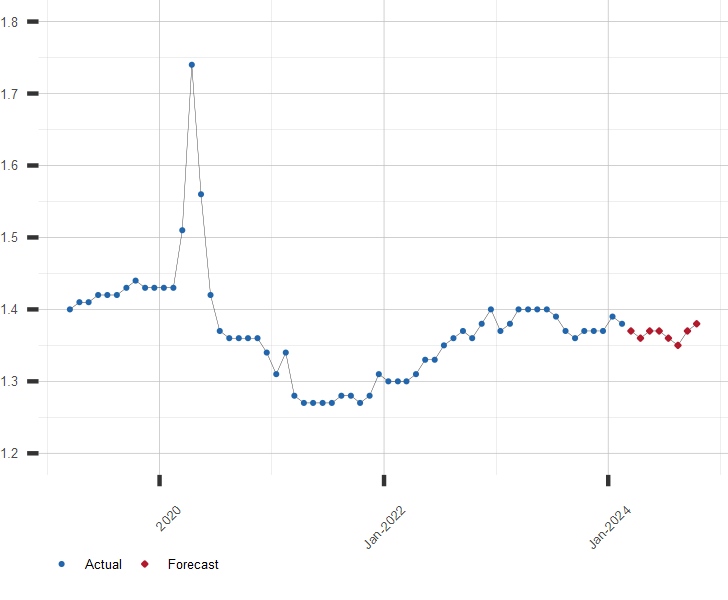
Chart of Inventory to Sales Ratio
Ratio Total Business Inventory to Sales. Seasonally Adjusted.
Other Business and Industry Resources:
A long range forecast for the Inventory to Sales Ratio and similar economic series is available by subscription. Click here for more information or to subscribe now
| June 08, 2026 | |
| Indicator | Value |
|---|---|
| S&P 500 | 7405.73 |
| U.S. GDP Growth, YoY % | 2.57 |
| U.S. Inflation Rate, % | 3.81 |
| Gold Price, $/oz-t | 4327.50 |
| Crude Oil Futures, $/bbl | 91.25 |
| U.S. 10 Year Treasury, % | 4.56 |