U.S. Monetary Base Forecast
U.S. Total Monetary Base Forecast Values
Billion US Dollars. Not Seasonally Adjusted.
| Month | Date | Forecast Value | Avg Error |
|---|---|---|---|
| 0 | May 2026 | 5538.6 | ±0.0 |
| 1 | Jun 2026 | 5556.0 | ±36.0 |
| 2 | Jul 2026 | 5571.0 | ±40.8 |
| 3 | Aug 2026 | 5594.0 | ±43.6 |
| 4 | Sep 2026 | 5624.0 | ±45.6 |
| 5 | Oct 2026 | 5646.0 | ±47.1 |
| 6 | Nov 2026 | 5692.0 | ±48.4 |
| 7 | Dec 2026 | 5767.0 | ±49.4 |
| 8 | Jan 2027 | 5754.0 | ±50.3 |
Get the Rest of the Story with the 5 Year Forecast!
Chart of U.S. Monetary Base
Billion US Dollars. Not Seasonally Adjusted.
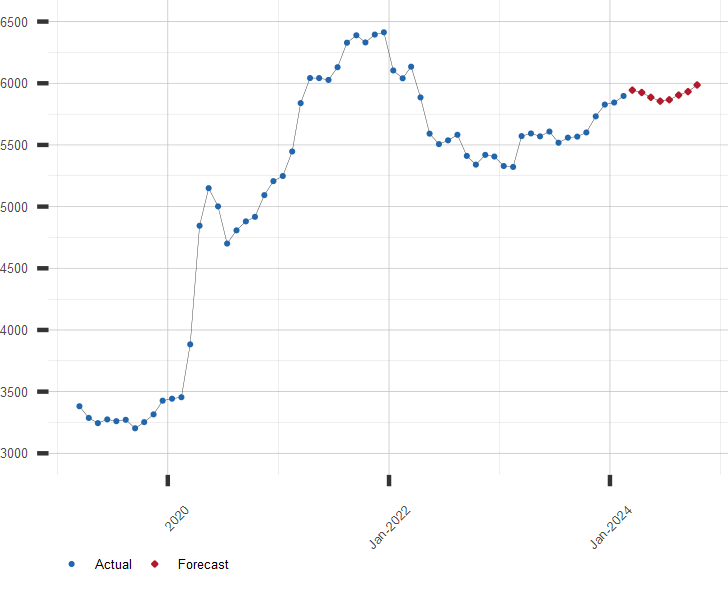
Monetary Base
The U.S. monetary base is the sum of currency in circulation outside the Federal Reserve and U.S. Treasury deposits at Federal Reserve banks.
Other Banking Resources of Interest:
A long range forecast for US Monetary Base and similar economic series is available by subscription
Click here to subscribe to the Extended Forecasts.| July 20, 2026 | |
| Indicator | Value |
|---|---|
| S&P 500 | 7443.28 |
| U.S. GDP Growth, YoY % | 2.68 |
| U.S. Inflation Rate, % | 3.53 |
| Gold Price, $/oz-t | 4007.00 |
| Crude Oil Futures, $/bbl | 82.43 |
| U.S. 10 Year Treasury, % | 4.60 |