Russell 2000 Stock Index Forecast
Russell 2000 Forecast Values
Stock Price Index Values. Average of Month.
| Month | Date | Forecast Value | Avg Error |
|---|---|---|---|
| 0 | May 2026 | 2847.55 | ±0.00 |
| 1 | Jun 2026 | 2941.0 | ±45.0 |
| 2 | Jul 2026 | 2982.0 | ±48.7 |
| 3 | Aug 2026 | 3017.0 | ±50.8 |
| 4 | Sep 2026 | 3047.0 | ±52.3 |
| 5 | Oct 2026 | 3093.0 | ±53.5 |
| 6 | Nov 2026 | 3143.0 | ±54.5 |
| 7 | Dec 2026 | 3218.0 | ±55.3 |
| 8 | Jan 2027 | 3266.0 | ±56.0 |
Get the Rest of the Story with the 5 Year Forecast!
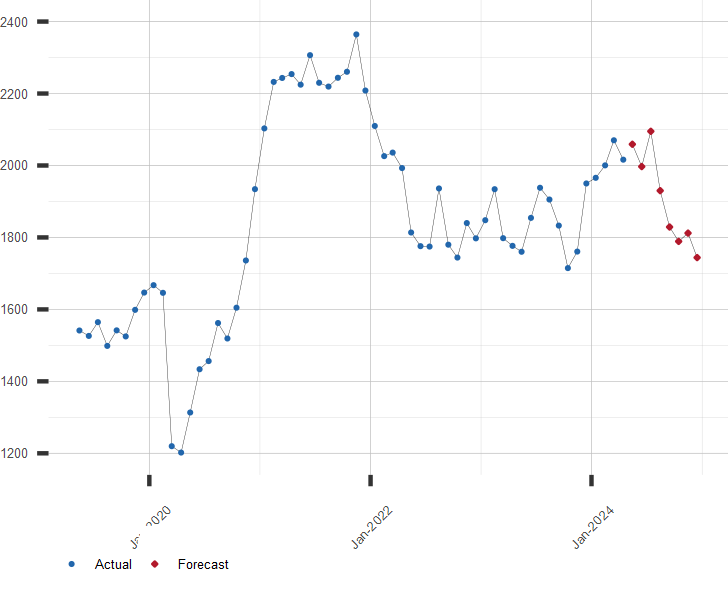
Chart of the Russell 2000 Index
Index Values. Average of Month
Other Stock Market and Russell Indexes Resources:
A long range forecast for the Russell 2000 and similar financial series is available by subscription. Click here for more information or to subscribe now
| June 9, 2026 | ||
| Stock Market | Value | Change |
|---|---|---|
| U.S. S&P 500 | 7,386.65 | -0.26% |
| Japan Nikkei 225 | 65,416.63 | 2.17% |
| Hong Kong Hang Seng | 24,565.90 | -0.37% |
| UK FTSE 100 | 10,227.33 | -1.41% |
| German DAX | 24,433.06 | -0.74% |
| Brazil Bovespa | 169,813.16 | 0.68% |